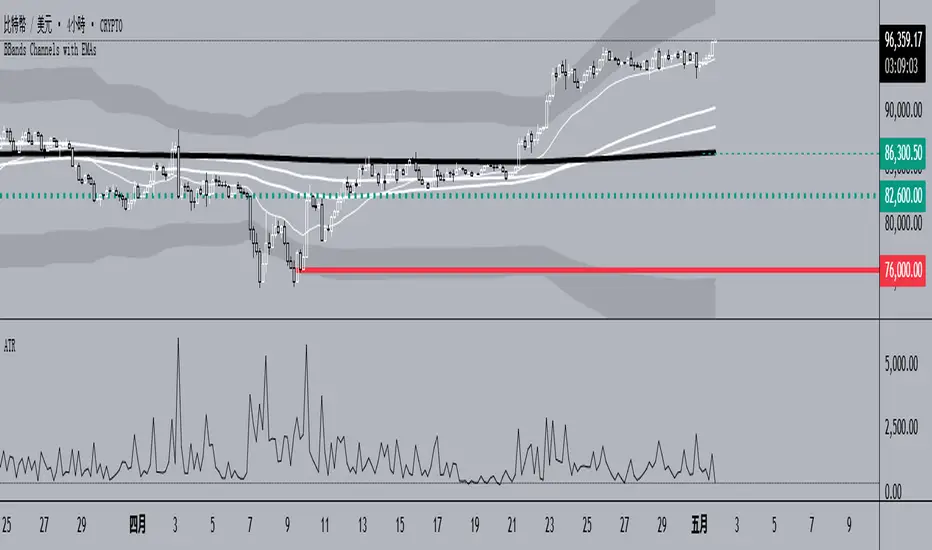
BBands Channels with EMAs# **BBands Channels with EMAs Indicator Explanation**
---
## **📌 Feature Overview**
### **1. Bollinger Bands**
- **Basis Line**: 160-period SMA (adjustable)
- **Inner Bands**:
- **Upper**: Basis + 2× Standard Deviation
- **Lower**: Basis - 2× Standard Deviation
- **Outer Bands**:
- **Upper Top**: Basis + 3× Standard Deviation
- **Lower Low**: Basis - 3× Standard Deviation
- **Fill Effect**: Semi-transparent black fill between inner and outer bands
### **2. Exponential Moving Averages (EMAs)**
| Period | Purpose | Line Style |
|--------------|-----------------------------|------------------|
| **EMA 27** | Short-term trend | Thin line |
| **EMA 120** | Short-to-medium-term trend | Medium line |
| **EMA 200** | Medium-term trend | Medium line |
| **EMA 1120** | Ultra-long-term trend | Thick line |
---
## **⚙️ Parameter Settings**
### **Bollinger Bands**
| Parameter | Default | Description |
|---------------|---------|--------------------------------------|
| `length` | 160 | SMA calculation period |
| `mult` | 2.0 | Standard deviation multiplier (inner bands) |
| `multOuter` | 3.0 | Standard deviation multiplier (outer bands) |
| `offset` | 0 | Time offset for plots (±500 bars) |
### **Exponential Moving Averages (EMAs)**
| Parameter | Default | Description |
|-----------------|---------|---------------------------|
| `ema1Length` | 27 | EMA 1 period |
| `ema2Length` | 120 | EMA 2 period |
| `ema3Length` | 200 | EMA 3 period |
| `ema4Length` | 1120 | EMA 4 period |
---
## **📊 Use Cases**
### **1. Trend Confirmation**
- **Bullish Trend**: Price above EMA200 + Bollinger Band expansion
- **Bearish Trend**: Price below EMA200 + Bollinger Band expansion
### **2. Overbought/Oversold Signals**
- **Upper Band Touch**: Price reaches Upper Top → Potential overbought
- **Lower Band Touch**: Price reaches Lower Low → Potential oversold
### **3. Volatility Strategies**
- **Band Squeeze**: Narrowing gap between bands → Breakout warning
- **Band Expansion**: Price breaks outer band → Trend acceleration
---
**✅ Summary**
This indicator combines **Bollinger Bands + Multi-period EMAs** for:
- Trend tracking
- Volatility analysis
- Multi-timeframe strategies
---
# **BBands Channels with EMAs 指標說明**
---
## **📌 功能概述**
### **1. 布林通道 (Bollinger Bands)**
- **基礎線 (Basis Line)**: 160週期SMA(可調整)
- **內通道 (Inner Bands)**:
- 上軌 (Upper): 基礎線 + 2倍標準差
- 下軌 (Lower): 基礎線 - 2倍標準差
- **外通道 (Outer Bands)**:
- 上外軌 (Upper Top): 基礎線 + 3倍標準差
- 下外軌 (Lower Low): 基礎線 - 3倍標準差
- **填充效果**: 內外通道間半透明黑色填充
### **2. 指數移動平均線 (EMAs)**
| 週期 | 用途 | 線條樣式 |
|-------------|-------------------|-----------------|
| **EMA 27** | 短期趨勢 | 細線 |
| **EMA 120** | 中短期趨勢 | 中等線 |
| **EMA 200** | 中期趨勢 | 中等線 |
| **EMA 1120**| 超長期趨勢 | 粗線 |
---
## **⚙️ 參數設定**
### **布林通道 (Bollinger Bands)**
| 參數名 | 預設值 | 說明 |
|-------------|--------|---------------------------|
| `length` | 160 | SMA計算週期 |
| `mult` | 2.0 | 內通道標準差倍數 |
| `multOuter` | 3.0 | 外通道標準差倍數 |
| `offset` | 0 | 線圖時間偏移(±500根K棒) |
### **指數移動平均線 (EMAs)**
| 參數名 | 預設值 | 說明 |
|----------------|---------|-------------------|
| `ema1Length` | 27 | 第一條EMA週期 |
| `ema2Length` | 120 | 第二條EMA週期 |
| `ema3Length` | 200 | 第三條EMA週期 |
| `ema4Length` | 1120 | 第四條EMA週期 |
---
## **📊 應用場景**
### **1. 趨勢確認**
- **多頭趨勢**: 價格在EMA200上方 + 布林通道擴張
- **空頭趨勢**: 價格在EMA200下方 + 布林通道擴張
### **2. 超買超賣信號**
- **觸及外軌**: 價格觸碰Upper Top → 可能超買
- **觸及下軌**: 價格觸碰Lower Low → 可能超賣
### **3. 波動率策略**
- **通道收窄**: 內外通道間距縮小 → 突破預警
- **通道擴張**: 價格突破外軌 → 趨勢加速
---
**✅ 總結**
本指標透過**布林通道+多週期EMA**的組合,適用於:
- 趨勢跟蹤
- 波動率分析
- 多時間框架策略
Cerca negli script per "3 ema"
Combined EMA/Smiley & DEM System## 🔷 General Overview
This script creates an advanced technical analysis system for TradingView, combining multiple Exponential Moving Averages (EMAs), Simple Moving Averages (SMAs), dynamic Fibonacci levels, and ATR (Average True Range) analysis. It presents the results clearly through interactive, real-time tables directly on the chart.
---
## 🔹 Indicator Structure
The script consists of two main parts:
### **1. EMA & SMA Combined System with Fibonacci**
- **Purpose:**
Provides visual insights by comparing multiple EMA/SMA periods and identifying significant dynamic price levels using Fibonacci ratios around a calculated "Golden" line.
- **Components:**
- **Moving Averages (MAs)**:
- 20 EMAs (periods from 20 to 400)
- 20 SMAs (also from 20 to 400)
- **Golden Line:**
Calculated as the average of all EMAs and SMAs.
- **Dynamic Fibonacci Levels:**
Key ratios around the Golden line (0.5, 0.618, 0.786, 1.0, 1.272, 1.414, 1.618, 2.0) dynamically adjust based on market conditions.
- **Fibonacci Labels:**
Labels are shown next to Fibonacci lines, indicating their numeric value clearly on the chart.
- **Table (Top Right Corner):**
- Displays:
- **Input:** EMA/SMA periods sorted by their current average price levels.
- **AVG:** The average of corresponding EMA & SMA pairs.
- **EMA & SMA Values:** Individual EMA/SMA values clearly marked.
- **Dynamic Highlighting:** Highlights the row whose average (EMA+SMA)/2 is closest to the current price, helping identify immediate price action significance.
- **Sorting Logic:**
Each EMA/SMA pair is dynamically sorted based on their average values. Color coding (red/green) is used:
- **Green:** EMA/SMA pairs with shorter periods when their average is lower.
- **Red:** EMA/SMA pairs with longer periods when their average is lower.
- **Star (⭐):** Represents the "Golden" average clearly.
---
### **2. DEM System (Dynamic EMA/ATR Metrics)**
- **Purpose:**
Provides detailed ATR statistics to assess market volatility clearly and quickly.
- **Components:**
- **Moving Averages:**
- SMA lines: 25, 50, 100, 200.
- **Bollinger Bands:**
- Based on 20-period SMA of highs and standard deviation of lows.
- **ATR Analysis:**
- ATR calculations for multiple periods (1-day, 10, 20, 30, 40, 50).
- **ATR Premium:** Average ATR of all calculated periods, providing an overarching volatility indicator.
- **ATR Table (Bottom Right Corner):**
- Displays clearly structured ATR values and percentages relative to the current close price:
- Columns: **ATR Period**, **Value**, and **% of Close**.
- Rows: Each specific ATR (1D, 10, 20, 30, 40, 50), plus ATR premium.
- The ATR premium is highlighted in yellow to signify its importance clearly.
---
## 🔹 Key Features and Logic Explained
- **Dynamic EMA/SMA Sorting:**
The script computes the average of each EMA/SMA pair and sorts them dynamically on each bar, highlighting their relative importance visually. This allows traders to easily interpret the strength of current support/resistance levels based on moving averages.
- **Closest EMA/SMA Pair to Current Price:**
Calculates the absolute difference between the current price and all EMA/SMA averages, highlighting the closest one for quick reference.
- **Fibonacci Ratios:**
- Dynamically calculated Fibonacci levels based on the "Golden" EMA/SMA average give clear visual guidance for potential targets, supports, and resistances.
- Labels are continuously updated and placed next to levels for clarity.
- **ATR Volatility Analysis:**
- Provides immediate insight into market volatility with absolute and relative (percentage-based) ATR values.
- ATR premium summarizes volatility across multiple timeframes clearly.
---
## 🔹 Practical Use Case:
- Traders can quickly identify support/resistance and critical price zones through EMA/SMA and Fibonacci combinations.
- Useful in assessing immediate volatility, guiding stop-loss and take-profit levels through detailed ATR metrics.
- The dynamic highlighting in tables provides intuitive, real-time decision support for active traders.
---
## 🔹 How to Use this Script:
1. **Adjust EMA & SMA Lengths** from indicator settings if different periods are preferred.
2. **Monitor dynamic Fibonacci levels** around the "Golden" average to identify possible reversal or continuation points.
3. **Check EMA/SMA table:** Rows highlighted indicate immediate significance concerning current market price.
4. **ATR table:** Use volatility metrics for better risk management.
---
## 🔷 Conclusion
This advanced Pine Script indicator efficiently combines multiple EMAs, SMAs, dynamic Fibonacci retracement levels, and volatility analysis using ATR into a comprehensive real-time analytical tool, enhancing traders' decision-making capabilities by providing clear and actionable insights directly on the TradingView chart.

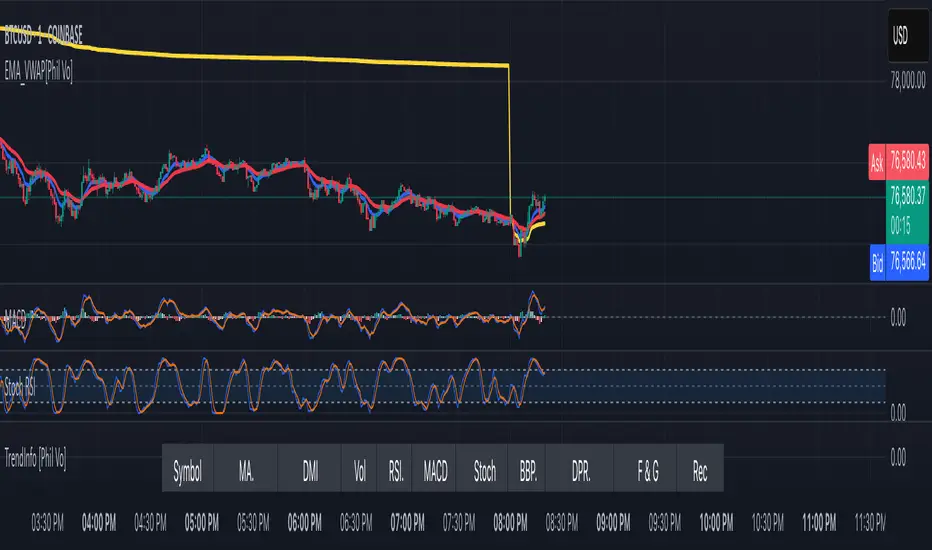
EMA and VWAP by Phil VoEMA and VWAP by Phil Vo
Description
This indicator combines two powerful technical analysis tools: Exponential Moving Averages (EMAs) and Volume Weighted Average Price (VWAP). Designed to assist traders in identifying trends and key price levels, this script overlays two customizable EMAs and a daily VWAP on your chart.
* EMA 1 (Blue): A fast-moving EMA with a default period of 9, ideal for short-term trend analysis.
* EMA 2 (Red): A slower EMA with a default period of 21, useful for confirming longer-term trends.
* VWAP (Yellow): The Volume Weighted Average Price, calculated using the typical price (HLC3) and volume, resetting daily. It serves as a dynamic support/resistance level and reflects the average price weighted by volume.
Features
* Customizable EMAs: Adjust the periods of both EMAs via the settings (minimum period: 1).
* Visual Clarity: Each line is plotted in a distinct color (Blue for EMA 1, Red for EMA 2, Yellow for VWAP) with a linewidth of 2 for easy identification.
* Daily VWAP: The VWAP resets at the start of each trading day, providing a reliable intraday reference point.
* Tooltips: Hover over the input settings to see descriptions of each EMA period.
How to Use
1. Add the indicator to your chart.
2. Customize the EMA periods in the settings if desired (defaults are 9 and 21).
3. Use the EMAs to spot trends:
* When EMA 1 crosses above EMA 2, it may signal a bullish trend.
* When EMA 1 crosses below EMA 2, it may indicate a bearish trend.
4. Use the VWAP as a dynamic support/resistance level:
* Prices above VWAP might suggest bullish momentum.
* Prices below VWAP might indicate bearish pressure.
Settings
* EMA 1 Length: Set the period for the fast EMA (default: 9).
* EMA 2 Length: Set the period for the slow EMA (default: 21).
Notes
* The VWAP resets daily by default, making it most suitable for intraday trading.
* This script is open-source under the Mozilla Public License 2.0, so feel free to study or modify it!
Author
Created by Phil Vo. Happy trading!
How to Add This to TradingView
When you publish the script:
1. Paste the description above into the "Description" field in the "Publish Script" dialog.
2. Set the title as "EMA and VWAP by Phil Vo".
3. Choose "Public" visibility and "Open" access to share it with the community.
4. Add tags like "EMA", "VWAP", "Moving Average", "Trend", and "Volume" to help users find it.
This description provides a clear explanation of the indicator’s purpose, usage instructions, and customization options, making it accessible and helpful for TradingView users. Let me know if you’d like to adjust anything!
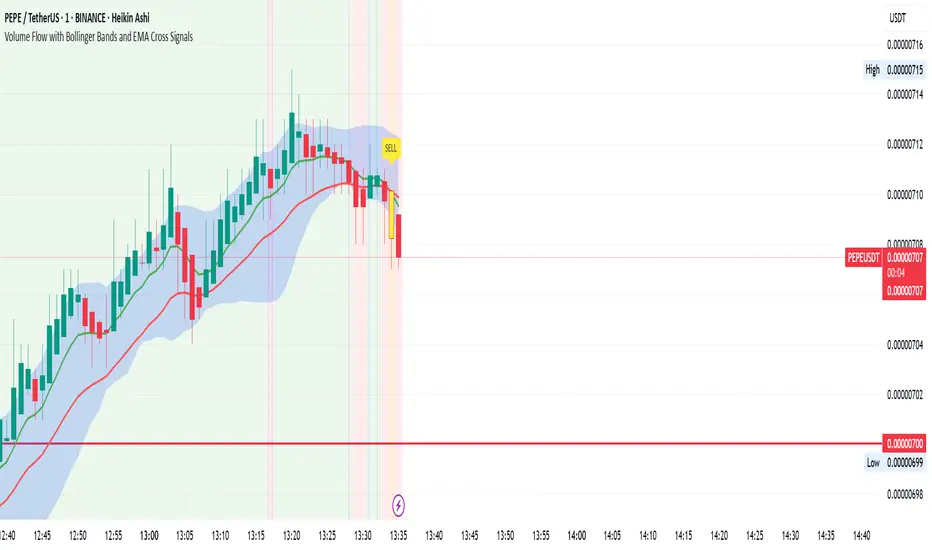
Volume Flow with Bollinger Bands and EMA Cross SignalsThe Volume Flow with Bollinger Bands and EMA Cross Signals indicator is a custom technical analysis tool designed to identify potential buy and sell signals based on several key components:
Volume Flow: This component combines price movement and trading volume to create a signal that indicates the strength or weakness of price movements. When the price is rising with increasing volume, it suggests strong buying activity, whereas falling prices with increasing volume indicate strong selling pressure.
Bollinger Bands: Bollinger Bands consist of three lines:
The Basis (middle line), which is a Simple Moving Average (SMA) of the price over a set period.
The Upper Band, which is the Basis plus a multiple of the standard deviation (typically 2).
The Lower Band, which is the Basis minus a multiple of the standard deviation. Bollinger Bands help identify periods of high volatility and potential overbought/oversold conditions. When the price touches the upper band, it might indicate that the market is overbought, while touching the lower band might indicate oversold conditions.
EMA Crossovers: The script includes two Exponential Moving Averages (EMAs):
Fast EMA: A shorter-term EMA, typically more sensitive to price changes.
Slow EMA: A longer-term EMA, responding slower to price changes. The crossover of the Fast EMA crossing above the Slow EMA (bullish crossover) signals a potential buy opportunity, while the Fast EMA crossing below the Slow EMA (bearish crossover) signals a potential sell opportunity.
Background Color and Candle Color: The indicator highlights the chart's background with specific colors based on the signals:
Green background for buy signals.
Yellow background for sell signals. Additionally, the candles are colored green for buy signals and yellow for sell signals to visually reinforce the trade opportunities.
Buy/Sell Labels: Small labels are placed on the chart:
"BUY" label in green is placed below the bar when a buy signal is generated.
"SELL" label in yellow is placed above the bar when a sell signal is generated.
Working of the Indicator:
Volume Flow Calculation: The Volume Flow is calculated by multiplying the price change (current close minus the previous close) with the volume. This product is then smoothed with a Simple Moving Average (SMA) over a user-defined period (length). The result is then multiplied by a multiplier to adjust its sensitivity.
Price Change = close - close
Volume Flow = Price Change * Volume
Smoothed Volume Flow = SMA(Volume Flow, length)
The Volume Flow Signal is then: Smooth Volume Flow * Multiplier
This calculation represents the buying or selling pressure in the market.
Bollinger Bands: Bollinger Bands are calculated using the Simple Moving Average (SMA) of the closing price (basis) and the Standard Deviation (stdev) of the price over a period defined by the user (bb_length).
Basis (Middle Band) = SMA(close, bb_length)
Upper Band = Basis + (bb_std_dev * Stdev)
Lower Band = Basis - (bb_std_dev * Stdev)
The upper and lower bands are plotted alongside the price to identify the price's volatility. When the price is near the upper band, it could be overbought, and near the lower band, it could be oversold.
EMA Crossovers: The Fast EMA and Slow EMA are calculated using the Exponential Moving Average (EMA) function. The crossovers are detected by checking:
Buy Signal (Bullish Crossover): When the Fast EMA crosses above the Slow EMA.
Sell Signal (Bearish Crossover): When the Fast EMA crosses below the Slow EMA.
The long_condition variable checks if the Fast EMA crosses above the Slow EMA, and the short_condition checks if it crosses below.
Visual Signals:
Background Color: The background is colored green for a buy signal and yellow for a sell signal. This gives an immediate visual cue to the trader.
Bar Color: The candles are colored green for buy signals and yellow for sell signals.
Labels:
A "BUY" label in green appears below the bar when the Fast EMA crosses above the Slow EMA.
A "SELL" label in yellow appears above the bar when the Fast EMA crosses below the Slow EMA.
Summary of Buy/Sell Logic:
Buy Signal:
The Fast EMA crosses above the Slow EMA (bullish crossover).
Volume flow is positive, indicating buying pressure.
Background turns green and candles are colored green.
A "BUY" label appears below the bar.
Sell Signal:
The Fast EMA crosses below the Slow EMA (bearish crossover).
Volume flow is negative, indicating selling pressure.
Background turns yellow and candles are colored yellow.
A "SELL" label appears above the bar.
Usage of the Indicator:
This indicator is designed to help traders identify potential entry (buy) and exit (sell) points based on:
The interaction of Exponential Moving Averages (EMAs).
The strength and direction of Volume Flow.
Price volatility using Bollinger Bands.
By combining these components, the indicator provides a comprehensive view of market conditions, helping traders make informed decisions on when to enter and exit trades.
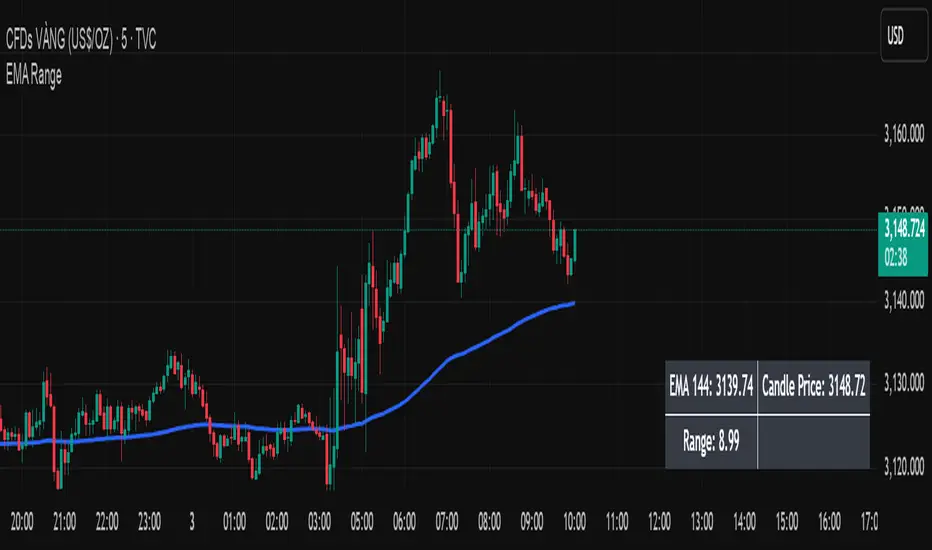
EMA Price Range by tuanduongEMA Price Range Indicator – Dynamic Range Analysis with Custom EMA (tuanduong2511)
Overview
The EMA Price Range Indicator is designed to help traders visualize the distance between price action and a key Exponential Moving Average (EMA). This indicator dynamically calculates the range from each candle to a user-defined EMA and displays it in a real-time table. By understanding the relationship between price and the EMA, traders can better gauge potential support, resistance, and overextension in the market.
Key Features
✅ Customizable EMA – Allows users to choose the EMA period that best suits their strategy (default: 144).
✅ Real-Time Range Calculation – Computes the absolute difference between the EMA and the price (using the high or low, depending on whether the candle is above or below the EMA).
✅ Minimalist UI – The EMA is plotted directly on the chart, while a small table in the bottom-right corner provides numerical insights, reducing chart clutter.
✅ Versatile Use Cases – Suitable for trend-following traders (identifying pullbacks to EMA) and mean-reversion traders (spotting extended price movements).
How It Works
User-Defined EMA:
The script calculates an Exponential Moving Average (EMA) based on the selected period.
EMA adapts dynamically, giving more weight to recent price movements.
Range Calculation:
If the price is above the EMA, the range is measured from the high point of the candle to the EMA.
If the price is below the EMA, the range is measured from the low point of the candle to the EMA.
This approach ensures that we’re measuring the most relevant distance for price interaction.
Live Table Display:
The current EMA value and the distance (range) from the price are displayed in a small table in the bottom-right corner of the chart.
How to Use It
📌 Trend Traders: Use the indicator to track pullbacks to key EMAs (e.g., EMA 50, 144, or 200). When the price is far from the EMA, it may indicate an overextended trend or potential retracement zone.
📌 Mean Reversion Traders: Look for extreme deviations between price and the EMA. Large distances can signal potential price snapbacks to the mean.
📌 Scalping & Day Trading: Short-term traders can use it with fast EMAs (e.g., EMA 21 or 34) to measure quick price movements relative to short-term momentum.
Why This Indicator?
Unlike traditional EMA indicators, which only plot a moving average, this script provides quantifiable price distance to the EMA, helping traders make data-driven decisions. It allows traders to answer:
✅ Is the price stretched too far from the EMA?
✅ Should I wait for a pullback before entering?
✅ Is the trend strong, or is the price losing momentum?
By integrating EMA-based range analysis, traders gain a clearer understanding of market conditions and can improve their entry, exit, and risk management strategies.
MTF Moving Averages (only EMA)MTF Moving Averages (only EMA)
This script provides a Multi-Timeframe (MTF) Exponential Moving Average (EMA) indicator for traders to visualize multiple EMAs across different timeframes directly on a single chart.
The indicator dynamically calculates and plots up to four EMAs per timeframe (15-minute, 30-minute, 1-hour, and Daily) with user-defined lengths, offering valuable insight into price trends and potential entry or exit points.
Key Features:
Multiple Timeframe Support: The script allows you to view EMAs from different timeframes simultaneously. This is especially useful for traders who follow trends across different timeframes to make more informed decisions.
Customizable Lengths: For each timeframe, the lengths of the EMAs are fully customizable. You can adjust the length of up to four EMAs per timeframe to suit your strategy.
EMA Calculation: The Exponential Moving Average (EMA) is used, which gives more weight to recent prices and reacts faster to price changes compared to the simple moving average (SMA).
Timeframe Flexibility: The indicator supports the following timeframes:
15-minute: Ideal for short-term traders and scalpers.
30-minute: For intraday trading with a slightly longer perspective.
1-hour: Suitable for swing traders and those who prefer a more medium-term view.
Daily: Great for longer-term trend-following strategies.
Interactive and User-Friendly: You can toggle the visibility of each EMA on each timeframe, allowing you to choose exactly which EMAs you wish to display, depending on your trading strategy.
Color-Coded for Clarity: The script uses distinct colors for each EMA on the chart:
Blue: EMA1
Green: EMA2
Red: EMA3
Purple: EMA4
Line Width Customization: Each plotted EMA line has a customizable width for better visual clarity.
Use Case:
Traders who use multiple timeframes for analysis (e.g., those using the "multi-timeframe analysis" technique) will find this script particularly useful. For example, a trader may look at the 15-minute chart to catch short-term movements, the 30-minute chart for intraday trends, the 1-hour chart for swing positions, and the Daily chart for identifying the overarching market trend. The script enables them to view the EMAs for all these timeframes in one glance without having to manually switch between them.
By observing the relationships between EMAs across multiple timeframes, traders can gain valuable insights into market conditions such as:
Crossovers: When a shorter-term EMA crosses above or below a longer-term EMA, it can signal a potential trend reversal or continuation.
Trend Strength: Multiple EMAs in alignment across different timeframes can indicate strong trend strength.
Support and Resistance: EMAs can act as dynamic support and resistance levels, guiding traders on price action levels to watch for potential price reversals.
Instructions:
Enable/Disable EMAs: Toggle on or off the EMAs for each timeframe (15-min, 30-min, 1-hour, Daily) using the script’s settings.
Adjust EMA Lengths: Change the default lengths for each EMA to match your preferred settings for different timeframes.
Monitor Key Levels: Watch how price interacts with the plotted EMAs to spot potential trading signals based on your strategy.
This indicator is designed to enhance your multi-timeframe analysis and help make more informed, data-driven trading decisions.

Austin MTF EMA Entry PointsAustin MTF EMA Entry Points
Overview
The Austin MTF EMA Entry Points is a custom TradingView indicator designed to assist traders in identifying high-probability entry points by combining multiple time frame (MTF) analysis. It leverages exponential moving averages (EMAs) from the daily, 1-hour, and 15-minute charts to generate buy and sell signals that align with the overall trend.
This indicator is ideal for traders who:
Want to trade in the direction of the broader daily trend.
Seek precise entry points on lower time frames (1H and 15M).
Prefer using EMAs as their main trend-following tool.
How It Works
Daily Trend Filter:
The indicator calculates the 50 EMA on the daily chart.
The daily EMA acts as the primary trend filter:
If the current price is above the daily 50 EMA, the trend is bullish.
If the current price is below the daily 50 EMA, the trend is bearish.
Lower Time Frame Entry Points:
The indicator calculates the 20 EMA on both the 1-hour (1H) and 15-minute (15M) time frames.
Buy and sell signals are generated when the price aligns with the trend on all three time frames:
Buy Signal: Price is above the daily 50 EMA and also above the 20 EMA on both the 1H and 15M charts.
Sell Signal: Price is below the daily 50 EMA and also below the 20 EMA on both the 1H and 15M charts.
Visual and Alert Features:
Plot Lines:
The daily 50 EMA is plotted in yellow for easy identification of the main trend.
The 20 EMA from the 1H chart is plotted in blue, and the 15M chart's EMA is in purple for comparison.
Buy/Sell Markers:
Green "Up" arrows appear for buy signals.
Red "Down" arrows appear for sell signals.
Alerts:
Alerts notify users when a buy or sell signal is triggered, making it easier to act on trading opportunities in real-time.
How to Use the Indicator
Identify the Main Trend:
Check the relationship between the price and the daily 50 EMA (yellow line):
Only look for buy signals if the price is above the daily 50 EMA.
Only look for sell signals if the price is below the daily 50 EMA.
Wait for Lower Time Frame Alignment:
For a valid signal, ensure that the price is also above or below the 20 EMA (blue and purple lines) on both the 1H and 15M time frames:
This alignment confirms short-term momentum in the same direction as the daily trend.
Act on Signals:
Use the arrows as visual cues for entry points:
Enter long trades on green "Up" arrows.
Enter short trades on red "Down" arrows.
The alerts will notify you of these signals, so you don’t have to monitor the chart constantly.
Exit Strategy:
Use your preferred stop-loss, take-profit, or trailing stop strategy.
You can also exit trades if the price crosses back below/above the daily 50 EMA, signaling a potential reversal.
Use Cases
Swing Traders: Use the daily trend filter to trade in the direction of the dominant trend, while using 1H and 15M signals to fine-tune entries.
Day Traders: Leverage the 1H and 15M time frames to capitalize on short-term momentum while respecting the broader daily trend.
Position Traders: Monitor the indicator to determine potential reversals or significant alignment across time frames.
Customizable Inputs
The indicator includes the following inputs:
Daily EMA Length: Default is 50. Adjust this to change the length of the trend filter EMA.
Lower Time Frame EMA Length: Default is 20. Adjust this to change the short-term EMA for the 1H and 15M charts.
Time Frames: Hardcoded to "D", "60", and "15", but you can modify the script for different time frames if needed.
Example Scenarios
Buy Signal:
Price is above the daily 50 EMA.
Price crosses above the 20 EMA on both the 1H and 15M time frames.
A green "Up" arrow is displayed, and an alert is triggered.
Sell Signal:
Price is below the daily 50 EMA.
Price crosses below the 20 EMA on both the 1H and 15M time frames.
A red "Down" arrow is displayed, and an alert is triggered.
Strengths and Limitations
Strengths:
Aligns trades with the higher time frame trend for increased probability.
Uses multiple time frame analysis to identify precise entry points.
Visual signals and alerts make it easy to use in real-time.
Limitations:
May produce fewer signals in choppy or ranging markets.
Requires discipline to avoid overtrading when conditions are unclear.
Lag in EMAs could result in late entries in fast-moving markets.
Final Notes
The Austin MTF EMA Entry Points indicator is a powerful tool for traders who value multiple time frame alignment and trend-following strategies. While it simplifies decision-making, it is always recommended to backtest and practice proper risk management before using it in live markets.
Try it out and make smarter, trend-aligned trades today! 🚀

Overnight Positioning w EMA - Strategy [presentTrading]I've recently started researching Market Timing strategies, and it’s proving to be quite an interesting area of study. The idea of predicting optimal times to enter and exit the market, based on historical data and various indicators, brings a dynamic edge to trading. Additionally, it is integrated with the 3commas bot for automated trade execution.
I'm still working on it. Welcome to share your point of view.
█ Introduction and How it is Different
The "Overnight Positioning with EMA " is designed to capitalize on market inefficiencies during the overnight trading period. This strategy takes a position shortly before the market closes and exits shortly after it opens the following day. What sets this strategy apart is the integration of an optional Exponential Moving Average (EMA) filter, which ensures that trades are aligned with the underlying trend. The strategy provides flexibility by allowing users to select between different global market sessions, such as the US, Asia, and Europe.
It is integrated with the 3commas bot for automated trade execution and has a built-in mechanism to avoid holding positions over the weekend by force-closing positions on Fridays before the market closes.
BTCUSD 20 mins Performance
█ Strategy, How it Works: Detailed Explanation
The core logic of this strategy is simple: enter trades before market close and exit them after market open, taking advantage of potential price movements during the overnight period. Here’s how it works in more detail:
🔶 Market Timing
The strategy determines the local market open and close times based on the selected market (US, Asia, Europe) and adjusts entry and exit points accordingly. The entry is triggered a specific number of minutes before market close, and the exit is triggered a specific number of minutes after market open.
🔶 EMA Filter
The strategy includes an optional EMA filter to help ensure that trades are taken in the direction of the prevailing trend. The EMA is calculated over a user-defined timeframe and length. The entry is only allowed if the closing price is above the EMA (for long positions), which helps to filter out trades that might go against the trend.
The EMA formula:
```
EMA(t) = +
```
Where:
- EMA(t) is the current EMA value
- Close(t) is the current closing price
- n is the length of the EMA
- EMA(t-1) is the previous period's EMA value
🔶 Entry Logic
The strategy monitors the market time in the selected timezone. Once the current time reaches the defined entry period (e.g., 20 minutes before market close), and the EMA condition is satisfied, a long position is entered.
- Entry time calculation:
```
entryTime = marketCloseTime - entryMinutesBeforeClose * 60 * 1000
```
🔶 Exit Logic
Exits are triggered based on a specified time after the market opens. The strategy checks if the current time is within the defined exit period (e.g., 20 minutes after market open) and closes any open long positions.
- Exit time calculation:
exitTime = marketOpenTime + exitMinutesAfterOpen * 60 * 1000
🔶 Force Close on Fridays
To avoid the risk of holding positions over the weekend, the strategy force-closes any open positions 5 minutes before the market close on Fridays.
- Force close logic:
isFriday = (dayofweek(currentTime, marketTimezone) == dayofweek.friday)
█ Trade Direction
This strategy is designed exclusively for long trades. It enters a long position before market close and exits the position after market open. There is no shorting involved in this strategy, and it focuses on capturing upward momentum during the overnight session.
█ Usage
This strategy is suitable for traders who want to take advantage of price movements that occur during the overnight period without holding positions for extended periods. It automates entry and exit times, ensuring that trades are placed at the appropriate times based on the market session selected by the user. The 3commas bot integration also allows for automated execution, making it ideal for traders who wish to set it and forget it. The strategy is flexible enough to work across various global markets, depending on the trader's preference.
█ Default Settings
1. entryMinutesBeforeClose (Default = 20 minutes):
This setting determines how many minutes before the market close the strategy will enter a long position. A shorter duration could mean missing out on potential movements, while a longer duration could expose the position to greater price fluctuations before the market closes.
2. exitMinutesAfterOpen (Default = 20 minutes):
This setting controls how many minutes after the market opens the position will be exited. A shorter exit time minimizes exposure to market volatility at the open, while a longer exit time could capture more of the overnight price movement.
3. emaLength (Default = 100):
The length of the EMA affects how the strategy filters trades. A shorter EMA (e.g., 50) reacts more quickly to price changes, allowing more frequent entries, while a longer EMA (e.g., 200) smooths out price action and only allows entries when there is a stronger underlying trend.
The effect of using a longer EMA (e.g., 200) would be:
```
EMA(t) = +
```
4. emaTimeframe (Default = 240):
This is the timeframe used for calculating the EMA. A higher timeframe (e.g., 360) would base entries on longer-term trends, while a shorter timeframe (e.g., 60) would respond more quickly to price movements, potentially allowing more frequent trades.
5. useEMA (Default = true):
This toggle enables or disables the EMA filter. When enabled, trades are only taken when the price is above the EMA. Disabling the EMA allows the strategy to enter trades without any trend validation, which could increase the number of trades but also increase risk.
6. Market Selection (Default = US):
This setting determines which global market's open and close times the strategy will use. The selection of the market affects the timing of entries and exits and should be chosen based on the user's preference or geographic focus.

Day & Swing Trading EMA Clouds with Adaptive LevelsDay & Swing Trading EMA Clouds with Adaptive Levels is a tool designed for traders who need a flexible indicator that adapts to both short-term (day trading) and long-term (swing trading) strategies. The indicator blends EMA clouds and adaptive support/resistance levels, making it suitable for analyzing trend strength and key price zones.
How It Works:
EMA Clouds for Trend Detection:
This indicator uses three EMAs (Fast, Intermediate, Slow) to create two clouds:
Fast Cloud: The area between the fast and Intermediate EMAs.
Slow Cloud: The area between the Intermediate and slow EMAs.
The cloud colors change based on trend direction:
Positive (uptrend): When the fast EMA is above the Intermediate EMA (turquoise) or the Intermediate EMA is above the slow EMA (teal).
Negative (downtrend): When the fast EMA is below the Intermediate EMA (pink) or the Intermediate EMA is below the slow EMA (magenta).
Traders can use these clouds to visually gauge market momentum and trend reversals.
Adaptive EMA Settings Based on Trading Mode:
The EMA lengths adjust automatically depending on whether you're in Day Trading or Swing Trading mode:
Day Trading Mode uses shorter periods to capture quick price movements:
Fast EMA: 5-period
Mid EMA: 13-period
Slow EMA: 21-period
Swing Trading Mode uses longer periods to capture broader trends:
Fast EMA: 12-period
Mid EMA: 26-period
Slow EMA: 50-period
This dynamic adjustment allows you to switch between trading styles seamlessly, with the EMAs reflecting the most relevant timeframes for each strategy.
Adaptive Support and Resistance Levels:
Depending on the selected trading mode, the indicator dynamically plots key levels:
Day Trading Mode: Previous day’s high, low, and midpoint, as well as 2-day levels.
Swing Trading Mode: Previous month’s high, low, and midpoint, as well as 2-month levels.
These levels act as dynamic support and resistance zones, giving traders critical areas to monitor for potential reversals or breakouts.
Buy & Sell Signals:
Visual buy/sell signals are generated when the fast EMA crosses above or below the slow EMA. These signals can help traders identify potential trend reversals.
Customization:
You can fully adjust the transparency and colors of the clouds to fit your personal preferences and trading style.
Why This Combination?
Combining EMA clouds with adaptive levels provides traders with a complete picture. The clouds highlight the underlying market momentum and trend strength, while the adaptive levels offer potential entry/exit points based on historical price action. This unique mashup allows traders to follow trends and plan trades around key support and resistance zones.

Ema Z-score | viResearchEma Z-score | viResearch
Conceptual Foundation and Innovation
The "Ema Z-score" indicator introduces a novel method of analyzing price deviations from the mean by combining the Exponential Moving Average (EMA) with a Z-score calculation. The Z-score is a statistical measure that quantifies how far a value deviates from the mean in terms of standard deviations. By applying the Z-score to an EMA, this indicator provides traders with insights into the strength and momentum of price movements relative to a smoothed average. This enables better detection of overbought and oversold conditions, as well as potential trend reversals.
The use of the Z-score helps filter out noise and provides more robust signals by highlighting extreme deviations from the mean, allowing traders to make more informed decisions in both trending and ranging markets.
Technical Composition and Calculation
The "Ema Z-score" script consists of two main components: the Exponential Moving Average (EMA) and the Z-score calculation. The EMA is calculated over a user-defined length, smoothing price movements to provide a clearer trend line. The Z-score is then derived by measuring the deviation of the current EMA value from the mean of the EMA over a lookback period, divided by the standard deviation of the EMA during that same period.
For the Z-score calculation, the script first computes the mean EMA over the lookback period using the ta.ema function. It then calculates the standard deviation of the EMA over the same period using the ta.stdev function. The Z-score is determined by subtracting the mean EMA from the current EMA value and dividing by the standard deviation, producing a normalized measure of deviation from the average.
Features and User Inputs
The "Ema Z-score" script offers several customizable inputs that allow traders to adjust the indicator according to their strategies. The EMA Length controls the smoothing period of the EMA, while the Lookback Period defines how far back the script looks when calculating the mean and standard deviation for the Z-score. Customizable thresholds allow traders to define when the Z-score signals potential uptrends or downtrends, based on their chosen levels of deviation.
Practical Applications
The "Ema Z-score" indicator is designed for traders who want to better understand price deviations from the mean and use those insights to identify potential trading opportunities. This tool is particularly effective for:
Identifying Overbought and Oversold Conditions: The Z-score provides a quantitative measure of how far the price has deviated from the mean, helping traders spot extreme conditions that could lead to reversals. Detecting Trend Reversals: By monitoring when the Z-score crosses certain thresholds, traders can identify potential trend reversals early and adjust their positions accordingly. Confirming Trend Strength: The Z-score can help confirm whether a price move is backed by momentum or is likely to revert to the mean, providing additional context for trade entries and exits.
Advantages and Strategic Value
The "Ema Z-score" script offers a significant advantage by combining the smoothing effect of the EMA with the precision of Z-score analysis. This approach reduces the impact of market noise while highlighting meaningful deviations from the norm. The ability to quantify deviations in terms of standard deviations gives traders a statistical edge in identifying overbought or oversold conditions and potential trend shifts. This makes the "Ema Z-score" an effective tool for both trend-following and contrarian strategies.
Alerts and Visual Cues
The script includes alert conditions to notify traders of key Z-score threshold crossings. The "Ema Z-score Long" alert is triggered when the Z-score exceeds the upper threshold, signaling a potential upward trend. Conversely, the "Ema Z-score Short" alert signals a possible downward trend when the Z-score falls below the lower threshold. Visual cues such as color changes in the bar chart and Z-score plot help traders easily identify these conditions on the chart.
Summary and Usage Tips
The "Ema Z-score | viResearch" indicator offers a unique combination of EMA smoothing and Z-score analysis, giving traders a statistical measure of price deviations and improving their ability to detect overbought or oversold conditions, trend reversals, and trend confirmations. By incorporating this script into your trading strategy, you can better quantify price extremes and make more informed decisions in both volatile and stable markets. Whether you're focused on spotting early reversals or confirming ongoing trends, the "Ema Z-score" provides a reliable and customizable solution.
Note: Backtests are based on past results and are not indicative of future performance.

Support and resistance levels (Day, Week, Month) + EMAs + SMAs(ENG): This Pine 5 script provides various tools for configuring and displaying different support and resistance levels, as well as moving averages (EMA and SMA) on charts. Using these tools is an essential strategy for determining entry and exit points in trades.
Support and Resistance Levels
Daily, weekly, and monthly support and resistance levels play a key role in analyzing price movements:
Daily levels: Represent prices where a cryptocurrency has tended to bounce within the current trading day.
Weekly levels: Reflect strong prices that hold throughout the week.
Monthly levels: Indicate the most significant levels that can influence price movement over the month.
When trading cryptocurrencies, traders use these levels to make decisions about entering or exiting positions. For example, if a cryptocurrency approaches a weekly resistance level and fails to break through it, this may signal a sell opportunity. If the price reaches a daily support level and starts to bounce up, it may indicate a potential long position.
Market context and trading volumes are also important when analyzing support and resistance levels. High volume near a level can confirm its significance and the likelihood of subsequent price movement. Traders often combine analysis across different time frames to get a more complete picture and improve the accuracy of their trading decisions.
Moving Averages
Moving averages (EMA and SMA) are another important tool in the technical analysis of cryptocurrencies:
EMA (Exponential Moving Average): Gives more weight to recent prices, allowing it to respond more quickly to price changes.
SMA (Simple Moving Average): Equally considers all prices over a given period.
Key types of moving averages used by traders:
EMA 50 and 200: Often used to identify trends. The crossing of the 50-day EMA with the 200-day EMA is called a "golden cross" (buy signal) or a "death cross" (sell signal).
SMA 50, 100, 150, and 200: These periods are often used to determine long-term trends and support/resistance levels. Similar to the EMA, the crossings of these averages can signal potential trend changes.
Settings Groups:
EMA Golden Cross & Death Cross: A setting to display the "golden cross" and "death cross" for the EMA.
EMA 50 & 200: A setting to display the 50-day and 200-day EMA.
Support and Resistance Levels: Includes settings for daily, weekly, and monthly levels.
SMA 50, 100, 150, 200: A setting to display the 50, 100, 150, and 200-day SMA.
SMA Golden Cross & Death Cross: A setting to display the "golden cross" and "death cross" for the SMA.
Components:
Enable/disable the display of support and resistance levels.
Show level labels.
Parameters for adjusting offset, display of EMA and SMA, and their time intervals.
Parameters for configuring EMA and SMA Golden Cross & Death Cross.
EMA Parameters:
Enable/disable the display of 50 and 200-day EMA.
Color and style settings for EMA.
Options to use bar gaps and the "LookAhead" function.
SMA Parameters:
Enable/disable the display of 50, 100, 150, and 200-day SMA.
Color and style settings for SMA.
Options to use bar gaps and the "LookAhead" function.
Effective use of support and resistance levels, as well as moving averages, requires an understanding of technical analysis, discipline, and the ability to adapt the strategy according to changing market conditions.
(RUS) Данный Pine 5 скрипт предоставляет разнообразные инструменты для настройки и отображения различных уровней поддержки и сопротивления, а также скользящих средних (EMA и SMA) на графиках. Использование этих инструментов является важной стратегией для определения точек входа и выхода из сделок.
Уровни поддержки и сопротивления
Дневные, недельные и месячные уровни поддержки и сопротивления играют ключевую роль в анализе движения цен:
Дневные уровни: Представляют собой цены, на которых криптовалюта имела тенденцию отскакивать в течение текущего торгового дня.
Недельные уровни: Отражают сильные цены, которые сохраняются в течение недели.
Месячные уровни: Указывают на наиболее значимые уровни, которые могут влиять на движение цены в течение месяца.
При торговле криптовалютами трейдеры используют эти уровни для принятия решений о входе в позицию или закрытии сделки. Например, если криптовалюта приближается к недельному уровню сопротивления и не удается его преодолеть, это может стать сигналом для продажи. Если цена достигает дневного уровня поддержки и начинает отскакивать вверх, это может указывать на возможность открытия длинной позиции.
Контекст рынка и объемы торговли также важны при анализе уровней поддержки и сопротивления. Высокий объем при приближении к уровню может подтвердить его значимость и вероятность последующего движения цены. Трейдеры часто комбинируют анализ различных временных рамок для получения более полной картины и улучшения точности своих торговых решений.
Скользящие средние
Скользящие средние (EMA и SMA) являются еще одним важным инструментом в техническом анализе криптовалют:
EMA (Exponential Moving Average): Экспоненциальная скользящая средняя, которая придает большее значение последним ценам. Это позволяет более быстро реагировать на изменения в ценах.
SMA (Simple Moving Average): Простая скользящая средняя, которая равномерно учитывает все цены в заданном периоде.
Основные виды скользящих средних, которые используются трейдерами:
EMA 50 и 200: Часто используются для выявления трендов. Пересечение 50-дневной EMA с 200-дневной EMA называется "золотым крестом" (сигнал на покупку) или "крестом смерти" (сигнал на продажу).
SMA 50, 100, 150 и 200: Эти периоды часто используются для определения долгосрочных трендов и уровней поддержки/сопротивления. Аналогично EMA, пересечения этих средних могут сигнализировать о возможных изменениях тренда.
Группы настроек:
EMA Golden Cross & Death Cross: Настройка для отображения "золотого креста" и "креста смерти" для EMA.
EMA 50 & 200: Настройка для отображения 50-дневной и 200-дневной EMA.
Уровни поддержки и сопротивления: Включает настройки для дневных, недельных и месячных уровней.
SMA 50, 100, 150, 200: Настройка для отображения 50, 100, 150 и 200-дневных SMA.
SMA Golden Cross & Death Cross: Настройка для отображения "золотого креста" и "креста смерти" для SMA.
Компоненты:
Включение/отключение отображения уровней поддержки и сопротивления.
Показ ярлыков уровней.
Параметры для настройки смещения, отображения EMA и SMA, а также их временных интервалов.
Параметры для настройки EMA и SMA Golden Cross & Death Cross.
Параметры EMA:
Включение/отключение отображения 50 и 200-дневных EMA.
Настройки цвета и стиля для EMA.
Опции для использования разрыва баров и функции "LookAhead".
Параметры SMA:
Включение/отключение отображения 50, 100, 150 и 200-дневных SMA.
Настройки цвета и стиля для SMA.
Опции для использования разрыва баров и функции "LookAhead".
Эффективное использование уровней поддержки и сопротивления, а также скользящих средних, требует понимания технического анализа, дисциплины и умения адаптировать стратегию в зависимости от изменяющихся условий рынка.

Dee EMA 5.0
1. Indicator Features:
- The indicator can plot four different sets of EMA on a chart.
- The EMA values can be displayed on the chart with their respective names (e.g., ema9, ema20, etc.).
- The indicator allows customization of the EMA values.
2. Purpose of Dee_EMA 5.0:
- Dee_EMA 5.0 is a unique EMA indicator specially designed for traders to provide better insights and aid in trading decisions.
- The primary reason for building this indicator is to address the challenge of managing multiple time frames while using normal EMA tables.
- Traditional EMA tables might not show all EMA values across different time frames simultaneously, leading to time-consuming processes like shifting time frames and refreshing charts.
- Dee_EMA 5.0 solves this issue by displaying EMA values for different time frames in one table, allowing traders to make quick judgments without repeatedly changing time frames and refreshing charts.
3. Importance of Different Time Frame EMA Values:
- Different time frames EMA values are crucial in trading because they provide valuable insights into the market dynamics at various levels.
- When using shorter time frames (e.g., 1-minute), EMA values can help identify short-term trends, support, and resistance levels.
- On the other hand, using larger time frames (e.g., 5-minute or 15-minute) provides more data and increases the accuracy of EMA-based analysis, enabling traders to identify longer-term trends and potential price movements.
4. EMA Crossover Table:
- Traders often prefer a clutter-free chart without too many lines, but they still need access to EMA values for analysis.
- The EMA table and EMA crossover table serve this purpose by providing EMA values and EMA crossover information in a structured table format.
- With the EMA crossover table, traders can quickly check EMA values and crossovers across different time frames without having to switch time frames repeatedly, saving time and facilitating faster decision-making during trading.
In summary, Dee_EMA 5.0 is an EMA indicator designed to help traders efficiently analyze EMA values across different time frames, allowing for faster and more informed trading decisions. The EMA crossover table provides additional convenience by presenting EMA crossovers without cluttering the chart.

[CP]Pivot Boss Multi Timeframe CPR Inception with MACD and EMAINTRODUCTION:
This indicator combines multi-timeframe CPR bands with MACD Momentum and EMA trend, all projected on the candlestick chart through a novel visualization.
If you have seen my other indicators on TradingView, you would know that I use floor pivots a lot and “Secrets of a Pivot Boss” is my favorite book. While using floor pivots, time and again I have noticed an interesting price behavior,
Trending moves in price typically start from around the Central Pivot Range (CPR). The CPR could be from ANY timeframe. These moves can easily be caught using simple momentum and trend indicators like MACD and EMA crossovers.
Yes, it is that simple. Follow along to understand how to use this indicator.
INDICATOR SETTINGS:
RANGEBOUND MACD AND EMA MARKINGS:
TradingView limits the max number of labels that can be shown on a chart to 500. Therefore, if you go far back enough, you won't see any markings for the MACD or EMA setups. If you are looking to test the efficacy of this indicator in the past, change the start and end dates to your desired timeframe and then select the ‘Mark MACD and EMA Setups in Range?’ option.
MULTI TIMEFRAME CENTRAL PIVOT RANGE:
Here you can select CPRs and their bands from which timeframes are shown on the chart. I will share my favorite settings later in this description.
CPR CONFIGURATION:
Show CPR Labels: CPRs markings can carry labels, so that you don’t confuse between which line is what. Use this setting to toggle them On/Off.
Show Next Time Period Pivots: Check this option if you want to see the CPR of the next time period. This is typically done to figure out the ’Two Day CPR Relationship’ . Read the book, “Secrets of a Pivot Boss”, to understand more.
EMA TREND:
Show EMA on the Chart: EMAs will be plotted on the chart. Standard stuff.
Mark EMA Crossovers on Chart: EMA crossovers will be marked on the chart in diamond shapes. If you are using EMA crossovers, I recommend setting this option to True.
Rest of the EMA settings are fairly obvious.
MACD MOMENTUM:
Projecting MACD parameters directly on the candlesticks is surely going to give you a new perspective about price action and MACD.
Also, in order to better understand the MACD projections on the chart, you can add a standard MACD indicator on the chart with default settings to figure out what my indicator is actually showing you.
Marking MACD Crossovers on Chart: Marks the MACD signal crossovers on the chart. This visualization was a game changer for me.
Show MACD Histogram on Chart: Projects the complete MACD Histogram in a novel fashion (Try it!). You will be able to visually see the ebbs and flow of momentum in the charts.
Mark MACD Histogram Peaks on Chart: Marks only the MACD peaks instead of the complete histogram. Peaks are a great way to enter an ongoing trend and to play an intraday rangebound market.
Rest of the settings are just the standard settings that you will find in a typical MACD indicator.
ALERTS:
Not shown in the settings panel, but I have added alerts for EMA and MACD Crossovers so that you don’t have to sit in front of the charts or constantly check the price all day long.
If you don’t know how to set alerts in TradingView, then please Google it.
INDICATOR USAGE EXAMPLES:
This indicator can be used in intraday as well as in higher timeframes.
There are quite a few variations possible, I personally prefer to use the EMA crossovers in intraday (5m) and MACD on Daily timeframes.
This is just a matter of personal preference, some people might prefer using EMAs only or MACD only in all timeframes.
Here are my personal settings for the intraday 5-minute timeframe:
Turn on all the CPR pivots starting from Yearly all the way to Daily. You can turn on 6 hourly and 4 hourly as well if you want.
Hourly CPR is mostly used when the price is in a strong trend and you missed the entry and don’t know when to enter. Price will typically experience pullbacks towards the Hourly CPR, before resuming in the direction of the trend. That is your chance to hop onto the bandwagon.
For Intraday, I keep the Bands off. Just a personal preference here.
You can turn ON the Show CPR Labels , if you want.
Turn ON both the options in the EMA TREND section. You would want to see the EMA crossovers marked on the chart as well as the EMAs themselves, as the distance between the two EMAs will give you an idea about the strength of the trend.
Keep rest of the settings in the EMA section as default (you can change the colors if you wish). I keep the same EMAs as the ones kept in the MACD indicator. I like to keep things simple.
In the MACD MOMENTUM section, turn ON Mark MACD Histogram Peaks on Chart and all the other options turned OFF. Leave the other settings as default. By the way, these are the default settings of the standard MACD Indicator.
You can set up EMA Bullcross and Bearcross alarms if you like.
Before checking out the examples, remember one super simple rule:
SOME OF THE BEST TRENDING MOVES IN THE MARKET, BE IT INTRADAY OR OTHERWISE, ORIGINATE IN THE VICINITY OF A LARGER TIMEFRAME PIVOT/CPR.
Look for price settling above/below a pivot, and then a move away from the pivot in any direction is typically a trending move.
You can use hourly pivots or MACD Histogram peaks marked on the chart to enter an existing trend, or add to your positions.
Let’s have a look at a few recent intraday examples from the Crypto, Indian, and US equity markets.
I have added my comments in the charts to make you easily understand what is going on.
Understand that both, moving average crossover and MACD, will give out a lot of signals (chop) every day. But almost 70% of them are going to be fake signals. It is the signals that you get when the price is near a Pivot, that tend to convert into gorgeous trending moves that last.
BTC 5m Charts
NIFTY Futures 5m Charts (good intraday trends are hard to find here, as the market is very efficient)
TSLA 5m Charts
Some important points for using this indicator in higher timeframes:
For higher timeframes, my personal preference is to go with the MACD indicator. I personally find MACD to be lethal on daily and weekly timeframes, if you know how to use it well.
The default settings of the indicator are the settings I use for both, Daily and Weekly, timeframes. Additionally, I turn off the CPR labels.
In theory large trending moves still have a big probability to start near an important pivot level, however, in larger timeframes, trending moves can start from anywhere. They need not start in the vicinity of any important pivot (but they often do!).
Weekly pivots can act as great pullback levels when the price is in strong momentum, when trading on the daily timeframe.
Quarterly Pivots act as great pullback levels when the price is in strong momentum, when trading on the weekly timeframe.
BTC Weekly Chart
BTC Daily Chart
Nifty Weekly Chart
Nifty Daily Chart
NASDAQ Weekly Chart
NASDAQ Daily Chart
FINAL WORDS:
Please understand that I have Cherry Picked the examples to showcase the capability of the indicator and its usage.
DO NOT conflate the accuracy of examples with the accuracy of this indicator.
Biggest catch is the fact that this indicator, like every other indicator out there, will have whipsaws. Some I have also marked in the example charts.
You need to come up with your own technique to avoid whipsaws, one technique I have shared here…… big moves typically start near pivots.
Work on avoiding whipsaws and finding you own edge in the markets.
If you really want to learn how to use Pivots, read the book ’Secrets of a Pivot Boss’ . This book can change your life.

Swing EMAWhat is Swing EMA?
Swing EMA is an exponential moving average crossover-based indicator used for low-risk directional trading.
it's used for different types of Ema 20,50,100 and 200, 3 of them are plotted on chat 20,100,200.
100 and 200 Ema is used for showing support and resistance and it contains highlights area between them and its change color according to market crossover condition.
20 moving average is used for knowing Market Behaviour and changing its color according to crossover conditions of 50 and 20 Ema.
How does it work?
It contains 4 different types of moving averages 20,50,100, 200 out of 3 are plotted on the chart.
20 Ema is used for knowing current market behavior. Its changes its color based on the crossover of 50 Ema and 20 Ema, if 20 Ema is higher than 50 Ema then it changes its color to green, and its opposites are changed their color to red when 20 Ema is lower than 50 Ema.
100 and 200 Ema used as a support and resistance and is also contain highlighted areas between them its change their color based on the crossover if 100 Ema is higher than 200 Ema a then both of them are going to change color to Green and as an opposite, if 200 Ema is higher then 100 Ema is going to change its color to red.
So in simple word 100 and 200 Ema is used as support and resistance zone and 20 Ema is used to know current market behavior.
How to use it?
It is very easy to understand by looking at the example I gave where are the two different types of phrases. phrase bull phrase and bear phrase so 100 and 200 Ema is used as a support and resistance and to tell you which phrase is currently on the market on example there is a bull phrase on the left side and bear phrase on the right side by using your technical analysis you can find out a really good spot to buy your stocks on a bull phrase and too short on the bear phrase. 20 Ema is used as a knowing the current market behavior it doesn't make any difference on buying or selling as much as 100 Ema and 200 Ema.
Tips
Don't trade against the market.
Try trade on trending stocks rather than sideways stock.
The higher the area between 100 Ema and 200 Ema is the stronger the phrase.
Do Backtesting before real trading.
Enjoy Trading.

EMA 20/50/200 - Warning Note Before Cross EMA 20/50/200 - Smart Cross Detection with Customizable Alerts
A clean and minimalistic indicator that tracks three key Exponential Moving Averages (20, 50, and 200) with intelligent near-cross detection and customizable warning system.
═══════════════════════════════════════════════════════════════════
📊 KEY FEATURES
✓ Triple EMA System
• EMA 20 (Red) - Fast/Short-term trend
• EMA 50 (Yellow) - Medium/Intermediate trend
• EMA 200 (Green) - Slow/Long-term trend & major support/resistance
✓ Smart Near-Cross Detection
• Get warned BEFORE crosses happen (not after)
• Adjustable threshold percentage (how close is "close")
• Automatic hiding after cross to prevent false signals
• Configurable lookback period
✓ Dual Warning System
• Price Label: Appears directly on chart near EMAs
• Info Table: Positioned anywhere on your chart
• Both show distance percentage and direction
• Dynamic positioning to avoid blocking candles
✓ Color-Coded Alerts
• GREEN warning = Bullish cross approaching (EMA 20 crossing UP through EMA 50)
• RED warning = Bearish cross approaching (EMA 20 crossing DOWN through EMA 50)
✓ Cross Signal Detection
• Golden Cross (EMA 50 crosses above EMA 200)
• Death Cross (EMA 50 crosses below EMA 200)
• Fast crosses (EMA 20 and EMA 50)
═══════════════════════════════════════════════════════════════════
⚙️ CUSTOMIZATION OPTIONS
Warning Settings:
• Custom warning text for bull/bear signals
• Adjustable opacity for better visibility
• Toggle distance and direction display
• Flexible table positioning (9 positions available)
• 5 text size options
Alert Settings:
• Golden/Death Cross alerts
• Fast cross alerts (20/50)
• Near-cross warnings (before it happens)
• All alerts are non-repainting
Display Options:
• Show/hide each EMA individually
• Toggle all signals on/off
• Adjustable threshold sensitivity
• Dynamic label positioning
═══════════════════════════════════════════════════════════════════
🎯 HOW TO USE
1. ADD TO CHART
Simply add the indicator to any chart and timeframe
2. ADJUST THRESHOLD
Default is 0.5% - increase for less frequent warnings, decrease for earlier warnings
3. SET UP ALERTS
Create alerts for:
• Near-cross warnings (get notified before the cross)
• Actual crosses (when EMA 20 crosses EMA 50)
• Golden/Death crosses (major trend changes)
4. CUSTOMIZE APPEARANCE
• Change warning text to your language
• Adjust opacity for your chart theme
• Position table where it's most convenient
• Choose label size for visibility
═══════════════════════════════════════════════════════════════════
💡 TRADING TIPS
- Use the near-cross warning to prepare entries/exits BEFORE the cross happens
- Green warning = Prepare for potential long position
- Red warning = Prepare for potential short position
- Combine with other indicators for confirmation
- Higher timeframes = more reliable signals
- Warning disappears after cross to avoid confusion
═══════════════════════════════════════════════════════════════════
🔧 TECHNICAL DETAILS
- Pine Script v6
- Non-repainting (all signals confirm on bar close)
- Works on all timeframes
- Works on all instruments (stocks, crypto, forex, futures)
- Lightweight and efficient
- No external data sources required
═══════════════════════════════════════════════════════════════════
📝 SETTINGS GUIDE
Near Cross Settings:
• Threshold %: How close EMAs must be to trigger warning (default 0.5%)
• Lookback Bars: Hide warning for X bars after a cross (default 3)
Warning Note Style:
• Text Size: Tiny to Huge
• Colors: Customize bull/bear warning colors
• Position: Place table anywhere on chart
• Opacity: 0 (solid) to 90 (very transparent)
Price Label:
• Size: Tiny to Large
• Opacity: Control transparency
• Auto-positioning: Moves to avoid blocking candles
Custom Text:
• Bull/Bear warning messages
• Toggle distance display
• Toggle direction display
═══════════════════════════════════════════════════════════════════
⚠️ IMPORTANT NOTES
- Warnings only appear BEFORE crosses, not after
- After a cross happens, warning is hidden for the lookback period
- Adjust threshold if you're getting too many/too few warnings
- This is a trend-following indicator - best used with confirmation
- Always use proper risk management
═══════════════════════════════════════════════════════════════════
Happy Trading! 📈📉
If you find this indicator useful, please give it a boost and leave a comment!
For questions or suggestions, feel free to reach out.

T3 Moving Average with Multiple EMAsT3 Moving Average with Multiple EMAs
Short Title: T3 + EMAs
Overview
The T3 Moving Average with Multiple EMAs is a versatile trend-following indicator that combines the smooth, adaptive T3 Moving Average with eight customizable multi-timeframe Exponential Moving Averages (EMAs). Designed for traders seeking clarity in trend direction and momentum, this indicator overlays on the price chart to highlight dynamic support/resistance levels and trend alignment across multiple timeframes.
Key Features
T3 Moving Average: A highly responsive, smoothed moving average (default: 9-period, 0.7 volume factor) that reduces lag while maintaining accuracy, ideal for identifying short-term trends and reversals.
Eight Multi-Timeframe EMAs: Plots eight EMAs (default lengths: 8, 13, 21, 34, 55, 89, 144, 233) sourced from user-defined timeframes (e.g., 1m, 5m, 15m, 1h, 4h), providing a comprehensive view of short-, medium-, and long-term trends.
Customizable Timeframes: Each EMA can be independently set to a specific timeframe, allowing traders to analyze cross-timeframe trend alignment.
Theme Support: Offers "Dark" and "Light" themes with optimized colors for visual clarity and chart compatibility.
Flexible Parameters: Adjust T3 length, volume factor, EMA lengths, and timeframes to suit various markets and trading styles (scalping, swing trading, or long-term investing).
How It Works
The T3 Moving Average is calculated using a multi-stage EMA formula weighted by a volume factor, offering smoother trend tracking than traditional EMAs. The eight EMAs, sourced from higher or lower timeframes using request.security, provide a layered perspective on price trends. Faster EMAs (e.g., 8, 13) react to short-term price movements, while slower EMAs (e.g., 144, 233) reflect longer-term trends. The indicator plots all lines on the price chart with distinct, theme-adjusted colors for easy identification.
Usage
Trend Identification: Use the T3 MA for short-term trend signals and the EMAs to confirm broader trend direction. A price above multiple EMAs suggests a bullish trend; below indicates bearish.
EMA Crossovers: Watch for crossovers between faster and slower EMAs (e.g., 8 crossing 21) for potential entry/exit signals.
Support/Resistance: Treat slower EMAs (e.g., 89, 144) as dynamic support/resistance levels, especially on higher timeframes.
Timeframe Alignment: Align trades with the trend direction of higher-timeframe EMAs for higher-probability setups.
Customization: Adjust T3 and EMA settings to match your trading style or asset volatility.
Settings
T3 Parameters:
Length (default: 9): Period for T3 calculation.
Volume Factor (default: 0.7): Controls T3 smoothness (0.1–1.0).
EMA Parameters:
Lengths (default: 8, 13, 21, 34, 55, 89, 144, 233): Period for each EMA.
Timeframes (default: 5m, 5m, 15m, 15m, 1h, 1h, 4h, 4h): Select from 1m, 5m, 15m, 30m, 1h, 4h, D, W, or M.
Theme: Choose "Dark" (vibrant colors) or "Light" (softer colors) for chart compatibility.
Notes
Combine with other tools (e.g., RSI, support/resistance, or volume) for confirmation.
Optimize settings for specific markets (e.g., crypto, forex, stocks) or timeframes.
The indicator is overlayed on the price chart for seamless integration with price action analysis.
Author’s Note
This indicator was designed to provide traders with a clear, multi-timeframe perspective on trends using the T3 MA and EMAs. Feedback is welcome to enhance this tool for the TradingView community!

Adaptive Cycle Oscillator with EMADescription of the Adaptive Cycle Oscillator with EMA Pine Script
This Pine Script, titled "Adaptive Cycle Oscillator with EMA", is a custom technical indicator designed for TradingView to help traders analyze market cycles and identify potential buy or sell opportunities. It combines an Adaptive Cycle Oscillator (ACO) with multiple Exponential Moving Averages (EMAs), displayed as colorful, wavy lines, and includes features like buy/sell signals and divergence detection. Below is a beginner-friendly explanation of how the script works, adhering to TradingView's Script Publishing Rules.
What This Indicator Does
The Adaptive Cycle Oscillator with EMA helps you:
Visualize market cycles using an oscillator that adapts to price movements.
Track trends with seven EMAs of different lengths, plotted as a rainbow of wavy lines.
Identify potential buy or sell signals when the oscillator crosses predefined thresholds.
Spot divergences between the oscillator and price to anticipate reversals.
Use customizable settings to adjust the indicator to your trading style.
Note: This is a technical analysis tool and does not guarantee profits. Always combine it with other analysis methods and practice risk management.
Step-by-Step Explanation for New Users
1. Understanding the Indicator
Adaptive Cycle Oscillator (ACO): The ACO analyzes price data (based on high, low, and close prices, or HLC3) to detect market cycles. It smooths price movements to create an oscillator that swings between overbought and oversold levels.
EMAs: Seven EMAs of different lengths are applied to the ACO and scaled based on the market's dominant cycle. These EMAs are plotted as colorful, wavy lines to show trend direction.
Buy/Sell Signals: The script generates signals when the ACO crosses above or below user-defined thresholds, indicating potential entry or exit points.
Divergence Detection: The script identifies bullish or bearish divergences between the ACO and the fastest EMA, which may signal potential reversals.
Visual Style: The indicator uses a rainbow of seven colors (red, orange, yellow, green, blue, indigo, violet) for the EMAs, with wavy lines for a unique visual effect. Static levels (zero, overbought, oversold) are also wavy for consistency.
2. How to Add the Indicator to Your Chart
Open TradingView and load the chart of any asset (e.g., stock, forex, crypto).
Click on the Indicators button at the top of the chart.
Search for "Adaptive Cycle Oscillator with EMA" (or paste the script into TradingView’s Pine Editor if you have access to it).
Click to add the indicator to your chart. It will appear in a separate panel below the price chart.
3. Customizing the Indicator
The script offers several input options to tailor it to your needs:
Base Cycle Length (Default: 20): Sets the initial period for calculating the dominant cycle. Higher values make the indicator slower; lower values make it more sensitive.
Alpha Smoothing (Default: 0.07): Controls how much the ACO smooths price data. Smaller values produce smoother results.
Show Buy/Sell Signals (Default: True): Toggle to display green triangles (buy) and red triangles (sell) on the chart.
Threshold (Default: 0.0): Defines overbought (above threshold) and oversold (below threshold) levels. Adjust to widen or narrow signal zones.
EMA Base Length (Default: 10): Sets the starting length for the fastest EMA. Other EMAs are incrementally longer (12, 14, 16, etc.).
Divergence Lookback (Default: 14): Determines how far back the script looks to detect divergences.
To adjust these:
Right-click the indicator on your chart and select Settings.
Modify the inputs in the pop-up window.
Click OK to apply changes.
4. Reading the Indicator
Oscillator and EMAs: The ACO and seven EMAs are plotted in a separate panel. The EMAs (colored lines) move in a wavy pattern:
Red (fastest) to Violet (slowest) represent different response speeds.
When the faster EMAs (e.g., red, orange) are above slower ones (e.g., blue, violet), it suggests bullish momentum, and vice versa.
Zero Line: A gray wavy line at zero acts as a neutral level. The ACO above zero indicates bullish conditions; below zero indicates bearish conditions.
Overbought/Oversold Lines: Red (overbought) and green (oversold) wavy lines mark threshold levels. Extreme ACO values near these lines may suggest reversals.
Buy/Sell Signals:
Green Triangle (Bottom): Appears when the ACO crosses above the oversold threshold, suggesting a potential buy.
Red Triangle (Top): Appears when the ACO crosses below the overbought threshold, suggesting a potential sell.
Divergences:
Green Triangle (Bottom): Indicates a bullish divergence (price makes a lower low, but the EMA makes a higher low), hinting at a potential upward reversal.
Red Triangle (Top): Indicates a bearish divergence (price makes a higher high, but the EMA makes a lower high), hinting at a potential downward reversal.
5. Using Alerts
You can set alerts for key events:
Right-click the indicator and select Add Alert.
Choose a condition (e.g., "ACO Buy Signal", "Bullish Divergence").
Configure the alert settings (e.g., notify via email, app, or pop-up).
Click Create to activate the alert.
Available alert conditions:
ACO Buy Signal: When the ACO crosses above the oversold threshold.
ACO Sell Signal: When the ACO crosses below the overbought threshold.
Bullish Divergence: When a potential upward reversal is detected.
Bearish Divergence: When a potential downward reversal is detected.
6. Tips for Using the Indicator
Combine with Other Tools: Use the indicator alongside support/resistance levels, candlestick patterns, or other indicators (e.g., RSI, MACD) for confirmation.
Test on Different Timeframes: The indicator works on any timeframe (e.g., 1-minute, daily). Shorter timeframes may produce more signals but with more noise.
Practice Risk Management: Never rely solely on this indicator. Set stop-losses and position sizes to manage risk.
Backtest First: Use TradingView’s Strategy Tester (if you convert the script to a strategy) to evaluate performance on historical data.
Compliance with TradingView’s Script Publishing Rules
This description adheres to TradingView’s Script Publishing Rules (as outlined in the provided link):
No Performance Claims: The description avoids promising profits or specific results, emphasizing that the indicator is a tool for analysis.
Clear Instructions: It provides step-by-step guidance for adding, customizing, and using the indicator.
Risk Disclaimer: It notes that trading involves risks and the indicator should be used with other analysis methods.
No Misleading Terms: Terms like “buy” and “sell” are used to describe signals, not guaranteed actions.
Transparency: The description explains the indicator’s components (ACO, EMAs, signals, divergences) without exaggerating its capabilities.
No External Links: The description avoids linking to external resources or soliciting users.
Educational Tone: It focuses on educating users about the indicator’s functionality.
Limitations
Not a Standalone System: The indicator is not a complete trading strategy. It provides insights but requires additional analysis.
Lagging Nature: As with most oscillators and EMAs, signals may lag behind price movements, especially in fast markets.
False Signals: Signals and divergences may not always lead to successful trades, particularly in choppy markets.
Market Dependency: Performance varies across assets and market conditions (e.g., trending vs. ranging markets).

EMA 50 + 200 Trend Signal TableEMA 50 + 200 Trend Signal Table (ETT)
This indicator provides a multi-timeframe trend signal table based on the 50-period and 200-period Exponential Moving Averages (EMAs). It visually plots the EMA 50 and EMA 200 on the chart, along with a customizable, compact table that indicates the trend direction across multiple timeframes. This tool is useful for traders looking to quickly identify market trends and momentum on various timeframes.
How It Works
- EMA Trend Analysis: The script compares the EMA 50 and EMA 200 values to determine the trend. When EMA 50 is above EMA 200, the trend is considered Bullish; if EMA 50 is below EMA 200, the trend is Bearish. If EMA 200 data is unavailable (e.g., on very short timeframes), the trend status will display as Neutral.
- Multi-Timeframe Trend Signals: The table displays the trend signals across five user-defined timeframes, updating in real time. Each timeframe row shows either Bullish, Bearish, or Neutral, with colors customizable to your preference.
Features
- EMA 50 and EMA 200 Visualization: Plots EMA 50 and EMA 200 lines directly on the chart. Users can customize the color and line thickness for each EMA to fit their charting style.
- Trend Signal Table: A table positioned on the chart (with options for positioning in the corners) shows the trend direction for the selected timeframes.
Bullish Trend: Highlighted in green (default) with 50% opacity.
Bearish Trend: Highlighted in red (default) with 50% opacity.
Neutral Trend: Highlighted in gray (default) with 50% opacity.
- Customizable Table Appearance: Allows users to select the position of the table (top-right, top-left, bottom-right, or bottom-left) and choose between compact sizes (Extra Small, Small, Normal).
- Adjustable Colors: Users can specify custom colors for each trend status (Bullish, Bearish, Neutral) as well as for the text and table border colors.
Inputs and Customizations
- Timeframes: Choose up to five different timeframes for trend analysis.
- EMA Colors and Line Widths: Customize the color and line width of EMA 50 and EMA 200 plotted on the chart.
- Table Settings: Control the position, size, and color options of the trend signal table for improved visibility and integration with your chart layout.
Use Case This indicator is ideal for traders who employ a multi-timeframe approach to confirm trends and filter entries. By monitoring the relative positions of EMA 50 and EMA 200 across various timeframes, traders can get a quick snapshot of trend strength and direction, aiding in informed trading decisions.

Multifactor Buy/Sell Strategy V2 | RSI, MACD, ATR, EMA, Boll.BITGET:1INCHUSDT
This Pine Script code for TradingView is a multifactor Buy/Sell indicator that combines several technical factors to generate trading signals based on trend, volatility, and volume conditions. Here’s a breakdown of the main components and functionality:
Indicator Name
- Multifactor Buy/Sell Strategy V2 — an overlay indicator applied directly on the price chart.
### Input Parameters
The script includes multiple customizable parameters:
- RSI, EMA, MACD parameters — for setting periods and signals of MACD and RSI.
- ATR and Bollinger Bands — used for volatility analysis and level determination.
- Minimum Volatility Threshold — sets a minimum Bollinger Band width threshold for determining high volatility.
Core Indicators
1. RSI — calculated to identify oversold (below 30) and overbought (above 70) conditions.
2. EMA and MACD — calculates exponential moving averages and MACD histogram to determine trend direction.
3. ATR and Bollinger Bands — used to assess current volatility and establish dynamic upper and lower bands.
Volatility and Volume Analysis
- Determines the current ATR level and Bollinger Band width to evaluate high volatility.
- Calculates the volume moving average to track periods of increased volume during high volatility.
Trend Analysis
The script uses the difference between fast and slow EMAs to define strong trends:
- Uptrend — when the fast EMA is above the slow EMA, the price is above the fast EMA, and the trend is strong.
- Downtrend — when the fast EMA is below the slow EMA, the price is below the fast EMA, and the trend is strong.
Momentum Filter
- Based on the price change over the last three bars and compared against the minimum volatility threshold to identify strong momentum.
Buy and Sell Signal Generation
- Buy Signal: Uptrend with RSI oversold, positive MACD histogram, high volatility and volume, strong momentum, and sufficient Bollinger Band width.
- Sell Signal: Downtrend with RSI overbought, negative MACD histogram, high volatility and volume, strong momentum, and sufficient Bollinger Band width.
Visualization
- Buy and sell signals are displayed as green and red triangles on the chart.
- Plots for fast and slow EMAs, upper and lower bands, and Bollinger Bands.
Alerts
The script includes alert conditions for buy and sell signals, allowing notifications to be sent via email or mobile app.
Information Panel
A small table on the chart displays current volatility dataThis Pine Script code for TradingView is a multifactor Buy/Sell indicator that combines several technical factors to generate trading signals based on trend, volatility, and volume conditions. Here’s a breakdown of the main components and functionality:
Indicator Name
- Multifactor Buy/Sell Strategy V2 — an overlay indicator applied directly on the price chart.
Input Parameters
The script includes multiple customizable parameters:
- **RSI, EMA, MACD parameters** — for setting periods and signals of MACD and RSI.
- **ATR and Bollinger Bands** — used for volatility analysis and level determination.
- **Minimum Volatility Threshold** — sets a minimum Bollinger Band width threshold for determining high volatility.
Core Indicators
1. RSI — calculated to identify oversold (below 30) and overbought (above 70) conditions.
2. EMA and MACD — calculates exponential moving averages and MACD histogram to determine trend direction.
3. ATR and Bollinger Bands — used to assess current volatility and establish dynamic upper and lower bands.
Volatility and Volume Analysis
- Determines the current ATR level and Bollinger Band width to evaluate high volatility.
- Calculates the volume moving average to track periods of increased volume during high volatility.
Trend Analysis
The script uses the difference between fast and slow EMAs to define strong trends:
- Uptrend — when the fast EMA is above the slow EMA, the price is above the fast EMA, and the trend is strong.
- Downtrend — when the fast EMA is below the slow EMA, the price is below the fast EMA, and the trend is strong.
Momentum Filter
- Based on the price change over the last three bars and compared against the minimum volatility threshold to identify strong momentum.
Buy and Sell Signal Generation
- Buy Signal: Uptrend with RSI oversold, positive MACD histogram, high volatility and volume, strong momentum, and sufficient Bollinger Band width.
- Sell Signal: Downtrend with RSI overbought, negative MACD histogram, high volatility and volume, strong momentum, and sufficient Bollinger Band width.
Visualization
- Buy and sell signals are displayed as green and red triangles on the chart.
- Plots for fast and slow EMAs, upper and lower bands, and Bollinger Bands.
Alerts
The script includes alert conditions for buy and sell signals, allowing notifications to be sent via email or mobile app.
Information Panel
A small table on the chart displays current volatility
- Volatility Status — indicates high or low volatility.
- Bollinger Band Width — current width as a percentage.
- ATR Ratio — ratio of current ATR to long-term average ATR.
This script is suitable for trading in high-volatility conditions, combining multiple filters and factors to generate precise buy and sell signals.

Rainbow EMA Areas with Volatility HighlightThe indicator provides traders with an enhanced visual tool to observe price movements, trend strength, and market volatility on their charts. It combines multiple EMAs (Exponential Moving Averages) with color-coded areas to indicate the market’s directional bias and a high-volatility highlight for detecting times of increased market activity.
Explanation of Key Components
Multiple EMAs (Exponential Moving Averages):
Six different EMAs are calculated for various periods (15, 45, 100, 150, 200, 300).
Each EMA period represents a different timeframe, from short-term to long-term trends, providing a well-rounded view of price behavior across different market cycles.
The EMAs are color-coded for easy differentiation:
Green shades indicate bullish trends when prices are above the EMAs.
Red shades indicate bearish trends when prices are below the EMAs.
The space between each EMA is filled with a gradient color, creating a "wave" effect that helps identify the market’s overall direction.
ATR-Based Volatility Detection:
The ATR (Average True Range), a measure of market volatility, is used to assess how much the price is fluctuating. When volatility is high, price movements are typically more significant, indicating potential trading opportunities or times to exercise caution.
The indicator calculates ATR and uses a customizable multiplier to set a high-volatility threshold.
When the ATR exceeds this threshold, it signals that the market is experiencing high volatility.
Visual High Volatility Highlight:
A yellow background appears on the chart during periods of high volatility, giving a subtle but clear visual indication that the market is active.
This highlight helps traders spot potential breakout areas or increased activity zones without obstructing the EMA areas.
Volatility Signal Markers:
Small, red triangular markers are plotted above price bars when high volatility is detected, marking these areas for additional emphasis.
These signals serve as alerts to help traders quickly recognize high volatility moments where price moves may be stronger.
How to Use This Indicator
Identify Trends Using EMA Areas:
Bullish Trend: When the price is above most or all EMAs, and the EMA areas are colored in shades of green, it indicates a strong bullish trend. Traders might look for buy opportunities in this scenario.
Bearish Trend: When the price is below most or all EMAs, and the EMA areas are colored in shades of red, it signals a bearish trend. This condition can suggest potential sell opportunities.
Consolidation or Neutral Trend: If the price is moving within the EMA bands without a clear green or red dominance, the market may be in a consolidation phase. This period often precedes a breakout in either direction.
Volatility-Based Entries and Exits:
High Volatility Areas: The yellow background and red triangular markers signal high-volatility areas. This information can be valuable for identifying potential breakout points or strong moves.
Trading in High Volatility: During high-volatility phases, the market may experience rapid price changes, which can be ideal for breakout trades. However, high volatility also involves higher risk, so traders may adjust their strategies accordingly (e.g., setting wider stops or adjusting position sizes).
Trading in Low Volatility: When the yellow background and markers are absent, volatility is lower, indicating a calmer market. In these times, traders may choose to look for range-bound trading opportunities or wait for the next trend to develop.
Combining with Other Indicators:
This indicator works well in combination with momentum or oscillating indicators like RSI or MACD, providing a well-rounded view of the market.
For example, if the indicator shows a bullish EMA area with high volatility, and an RSI is trending up, it could be a stronger buy signal. Conversely, if the indicator shows a bearish EMA area with high volatility and RSI is trending down, this could be a stronger sell signal.
Practical Trading Examples
Bullish Trend in High Volatility:
Price is above the EMAs, showing green EMA areas, and the high volatility background is active.
This indicates a strong bullish trend with significant price movement potential.
A trader could look for breakout or continuation entries in the direction of the trend.
Bearish Reversal Signal:
Price crosses below the EMAs, showing red EMA areas, while high volatility is also detected.
This suggests that the market may be reversing to a bearish trend with increased price movement.
Traders could consider taking short positions or setting stops on existing long trades.
This indicator is designed to provide a rich visual experience, making it easy to spot trends, consolidations, and volatility zones at a glance. It is best used by traders who benefit from visual cues and who seek a quick understanding of both trend direction and market activity. Let me know if you'd like further customization or additional functionalities!

Silen's EMA AreasAre you tired of reading candles? 🧨 Do you want to bring more meaning to your chart? 🧹
Then this is the script for you!
This script does:
- Add several meaningfully pre-configured EMA lines to your chart - up to EMA 300
- Colors the areas between EMA lines in 3d colors - green and red
- The Smaller the EMA, the firmer the color
- Highlights the EMA 300 in a golden color
What is the meaning of this?
Let me introduce a new word to you: EMA FOLDING .
Yes, you heard right. With this indicator you can see in 3D how EMA lines are folding above and below each other, indicating severe mood swings in the chart.
This helps you keep track of what your instrument is actually doing while it enables you to cancel out the noise and messyness of ordinary candles which can be quite random and hard to read.
Once an EMA is fully positive or negatively folded (all ema lines are green and above each other from largest EMA to smallest EMA and vice versa for negatively folded) you can be sure that you are in a Trend or certain mood (for higher timeframes, from 15mins on).
I don't ever want to read any chart without having this indicator on. Whenever I present charts to anybody I use this indicator - and the feedback is insanely positive. People tend to read and understand charts much better with this indicator than just staring at candles.
Why is this indicator different to other EMA indicators and should thereby not be deleted by the TradingView Team due to redundance with other EMA indicators?
- This is not a simple indicator for EMAs
- Rather, this is an indicator to better and easier read the whole chart
- You can detect mood swings very easily which is very hard to do with a normal EMA indicator
- I haven't found any EMA indicator on TradingView that does this job so i sincerely believe it is extremely unique
- I sincerely believe it can help people get a much better understanding of charts without actualy getting into details of EMA's or even needing to know what an EMA is.
This indicator isn't intended for trading purposes, rather it is intended to give you a better and easier understanding of the chart. Of course - you can also use it for your trading but like I said, that is not the primary intended purpose.
This indicator comes pre-configured with quite optimal values (in my opinion) but of course can be fully customized. 🧮
Test it for yourself!
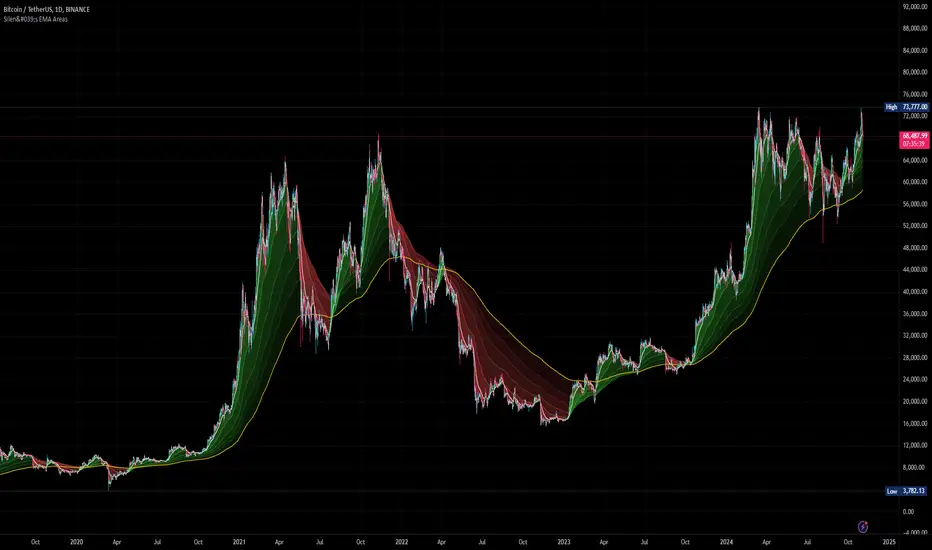
Two EMA Cross+ IndicatorHello traders!
Today we gonna demonstrate out heuristic of classical EMA Indicator. We decided to simplify your trading staff and add some meta data. So, let’s look at it from the very beginning and initially speak about what EMA is and then I’ll tell you why our indicator is extremely convenient and useful.
So, what is EMA? An exponential moving average ( EMA ) is a type of moving average (MA) that places a greater weight and significance on the most recent data points. The exponential moving average is also referred to as the exponentially weighted moving average . An exponentially weighted moving average reacts more significantly to recent price changes than a simple moving average ( SMA ), which applies an equal weight to all observations in the period.
Key takeaways:
-The EMA is a moving average that places a greater weight and significance on the most recent data points.
-Like all moving averages, this technical indicator is used to produce buy and sell signals based on crossovers and divergences from the historical average.
As you know, EMA Cross is one of basic and most popular Entry Indicators. It’s kinda easy to understand and even easier to use. This indicator consists of two EMAs - fast (red line) and slow (blue line). Fast EMA is EMA of less length that the fast EMA (default parameter is 9). Thus, it reacts the price change more actively than the slow. We can say that it takes into consideration the most actual price movements. Speaking about slow EMA (default parameter is 30) it’s more inert and it’s more difficult to change its action vastly. We can say that the EMA «looks» at the historical data more accurate, but doesn’t forget about actual price movements.
But how it works? Trivial. When the fast EMA crosses the slow bellow, it provides bearish signal, whereas when it crosses it above, it’s bullish signal. Even more, we added some «confirmation» factor. As you know, when the price is above the slow EMA, the slow EMA plays the role of support line for price and means that the price is in uptrend. Thus, when we see the cross above and it takes place under the price, we called it «strong Bullish Signal». When the price is bellow the slow EMA, slow EMA is resistance. Thus, when we see the cross bellow and it’s under the slow EMA, we called it «strong Bearish Signal».
To make your trading process easier, we plotted the places of crosses on the chart and added the descriptions of the crosses. The flags mean the place of cross. The default parameters have nice backtest on 1H chart. However, you can also change them depending on your goals and the time period. The places of cross looks like flags (red flag is «bearish» cross, green - «bullish»). As you can see, it’s really convenient.
I hope you’ll enjoy our heuristic of classical EMA Cross. We are sure that the meta data that we are taking into consideration makes the signals more accurate and the deals more profitable. The SkyRock Team with support of Trading View try to make your trading process more successful and profitable. Every day we works in conjunction to boost both your skills and trading balance. We hope, it’s really useful for you, dear traders!
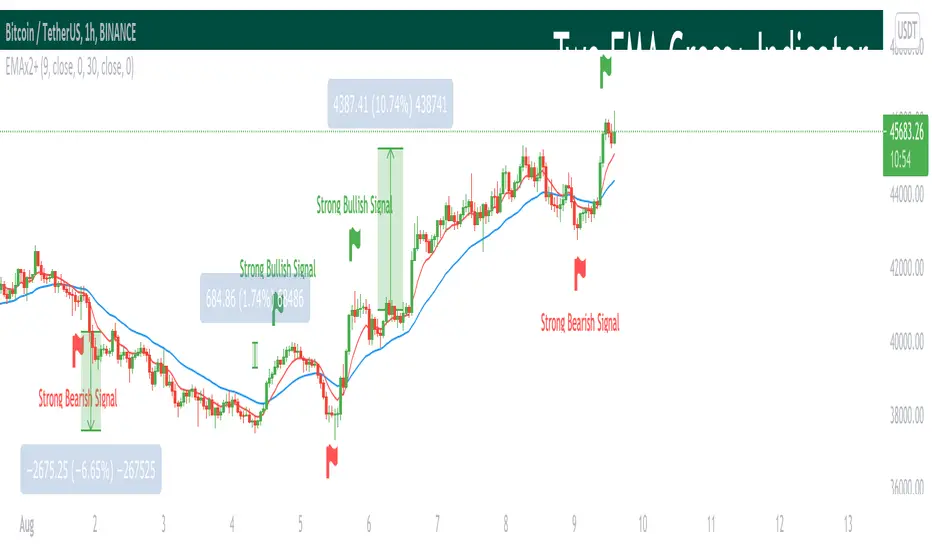
EMA Distance %# EMA Distance % - Daily Timeframe Analysis
## Overview
This indicator provides real-time analysis of price distance from key Exponential Moving Averages (EMA 10 and EMA 21) on the daily timeframe, regardless of your current chart timeframe. It displays both percentage and volatility-adjusted (ATR) distances in a clean, customizable table format.
## Key Features
- **Daily Timeframe Focus**: Always references daily EMA 10 and EMA 21 values, providing consistent analysis across all chart timeframes
- **Dual Distance Metrics**: Shows both percentage distance and ATR-normalized distance for comprehensive analysis
- **Customizable Table Position**: Position the data table anywhere on your chart (9 different locations available)
- **Color-Coded Results**: Green indicates price above EMA, red indicates price below EMA
- **Volatility Adjustment**: ATR distance provides context relative to the asset's typical price movements
## What It Shows
The indicator displays a table with the following information:
- **EMA Value**: Current daily EMA 10 and EMA 21 values
- **Distance %**: Percentage distance from each EMA (positive = above, negative = below)
- **ATR Distance**: How many Average True Range units the price is from each EMA
## Use Cases
- **Mean Reversion Trading**: Identify when price has moved significantly away from key EMAs
- **Trend Strength Analysis**: Gauge the strength of current trends relative to moving averages
- **Entry/Exit Timing**: Use ATR distances to identify potential reversal zones (typically 2-3+ ATR)
- **Multi-Timeframe Analysis**: View daily EMA relationships while analyzing shorter timeframes
- **Risk Management**: Understand volatility-adjusted distance for better position sizing
## Settings
- **Table Position**: Choose from 9 different table positions on your chart
- **ATR Period**: Customize the ATR calculation period (default: 14)
## Interpretation
- **Small distances (< 1% or < 1 ATR)**: Price near EMA support/resistance
- **Medium distances (1-3% or 1-2 ATR)**: Normal trending movement
- **Large distances (> 3% or > 2-3 ATR)**: Potential overextension, watch for mean reversion
Perfect for swing traders, position traders, and anyone using EMA-based strategies who wants quick access to daily timeframe EMA relationships without switching chart timeframes.
